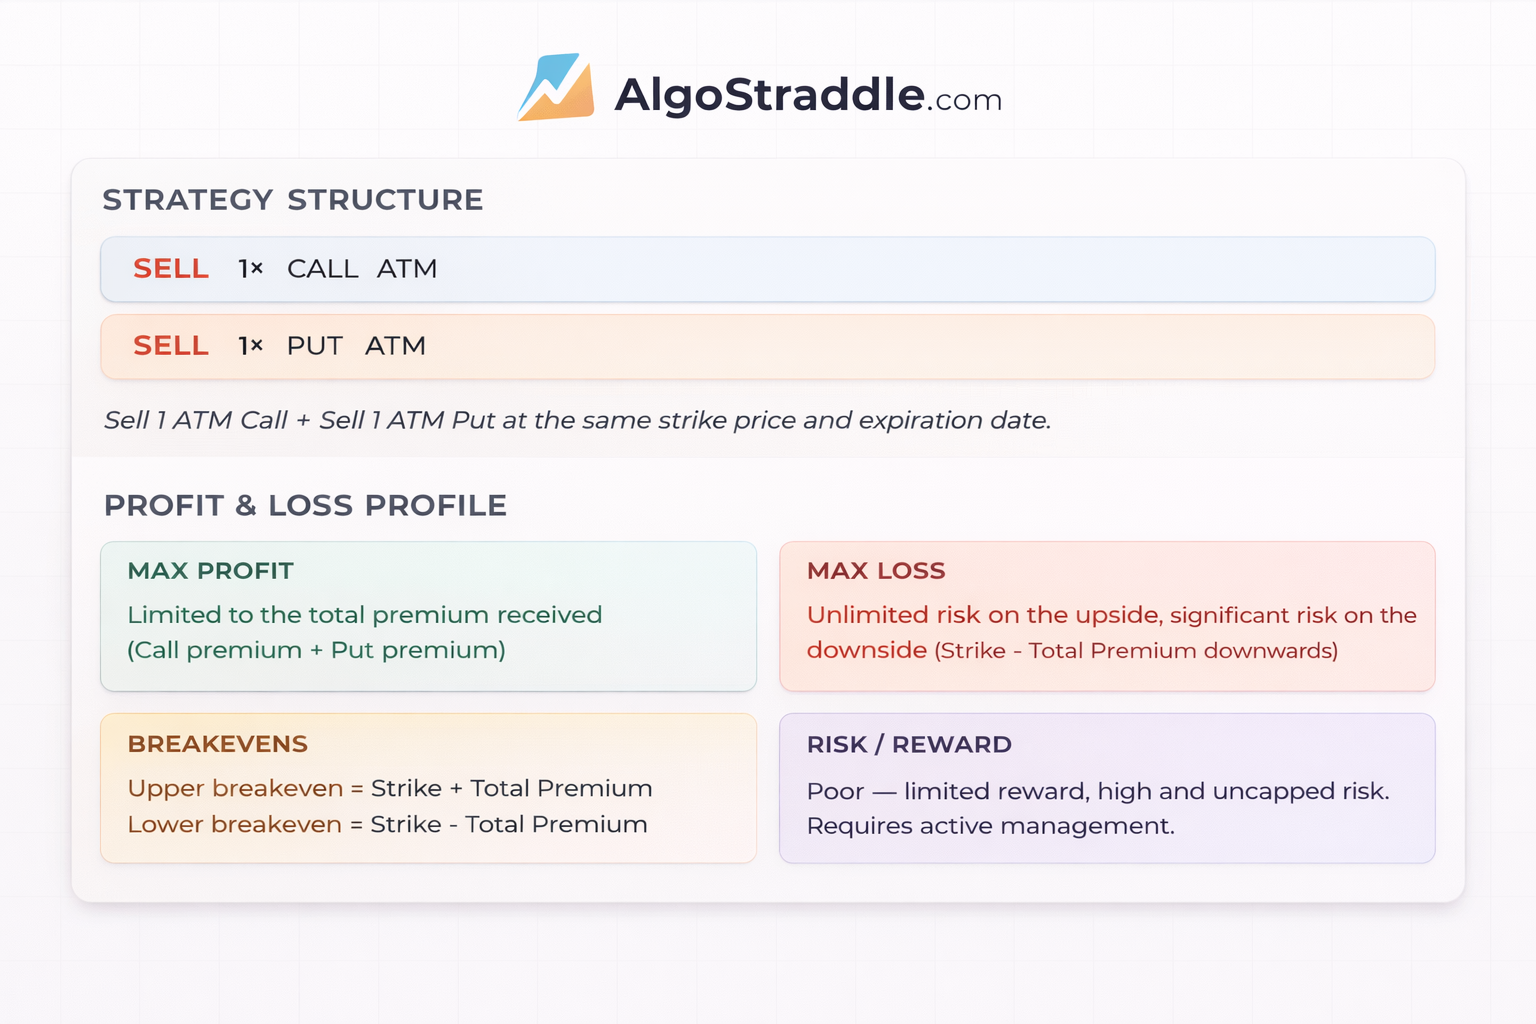
Sell ATM Call + ATM Put to collect maximum premium in low-volatility markets.
The short straddle is a premium-selling strategy where you simultaneously sell an at-the-money (ATM) call and an ATM put with the same strike and expiry. It profits when the underlying stays near the strike price and volatility contracts. This is one of the most popular strategies among Nifty option sellers.
When to Use NIFTY Straddle Chart
- Market is range-bound and IV is elevated
- You expect IV crush after an event (earnings, RBI policy, budget)
- No major economic data releases during the holding period
- You have capital for margin requirements and can actively manage
When to Avoid NIFTY Straddle Chart
- Before major events (RBI policy, elections, budget, global events)
- When India VIX is below 12 (low premiums, limited edge)
- In trending markets with strong directional momentum
- If you cannot monitor positions for adjustments
Ideal Conditions for Using NIFTY Straddle Chart
- High implied volatility (IV) that you expect to contract
- Range-bound market with no major events expected
- Weekly expiry for faster theta decay
- IV percentile above 60-70% for better premium collection
Adjustments & Risk Management Short Straddle Strategy
- Convert to iron butterfly by buying OTM wings (e.g., buy 22200 PE + 22800 CE) to cap risk
- Roll the tested side — if price breaks above upper breakeven, roll the call strike higher
- Add a directional hedge — buy a far OTM option on the side being tested
- Set a stop-loss at 1.5x to 2x the premium received
- Trail stop the untested side to lock in partial profits
Best time to Enter Short Straddle Strategy
The ideal entry for a short straddle is when IV is elevated relative to its recent range (IV percentile above 60%). This gives you an edge because you're selling expensive options that are likely to contract in value. Use IV percentile or IV rank rather than absolute IV levels to gauge relative expensiveness.
For weekly Nifty options, Tuesday or Wednesday entry (2-3 days before Thursday expiry) often offers a good balance of theta decay and time to manage. Avoid entering right before known events.
Greeks Impact on Short Straddle Strategy
Delta (Δ)
Near-zero at entry (ATM call delta ~+0.5, ATM put delta ~-0.5 cancel out). Delta shifts as price moves away from strike.
Gamma (Γ)
Negative gamma — the biggest risk. As the underlying moves, delta accelerates against you. Gamma risk is highest near expiry.
Theta (Θ)
Positive theta — time decay works in your favor. Maximum theta decay at ATM, accelerating into expiry.
Vega (ν)
Negative vega — profits when IV drops (IV crush). A 1-point drop in IV benefits the position significantly.